About the Data
We are committed to making our spatial profiling data available to the scientific community. Here you will find information describing the various HTA data types and how they are collected, analyzed, and shared.
Data Pipeline Minerva: Viewing Data Online Primary Data Access Image Data Standards
Data Types
HTA data currently includes:
| Data type | Description | Data standards, formats, repositories |
|---|---|---|
| High-plex image data | Collected using cyclic immunofluorescence (CyCIF), Orion, 3D CyCIF, and MIBI | OME-TIFF or other BioFormats file type. See MITI standards, below. |
| Single-cell spatial feature tables | Marker intensities and morphological features for each cell, quantified from high-plex images | csv file type. See MITI standards, below. |
| Dissociative mRNA-seq data | Single-cell expression profiles without spatial context | see GEO (Gene Expression Omnibus) |
| Spatial transcriptomics | Collected using micro-region transcript profiling methods like GeoMX | see GEO (Gene Expression Omnibus) |
DATA PIPELINE
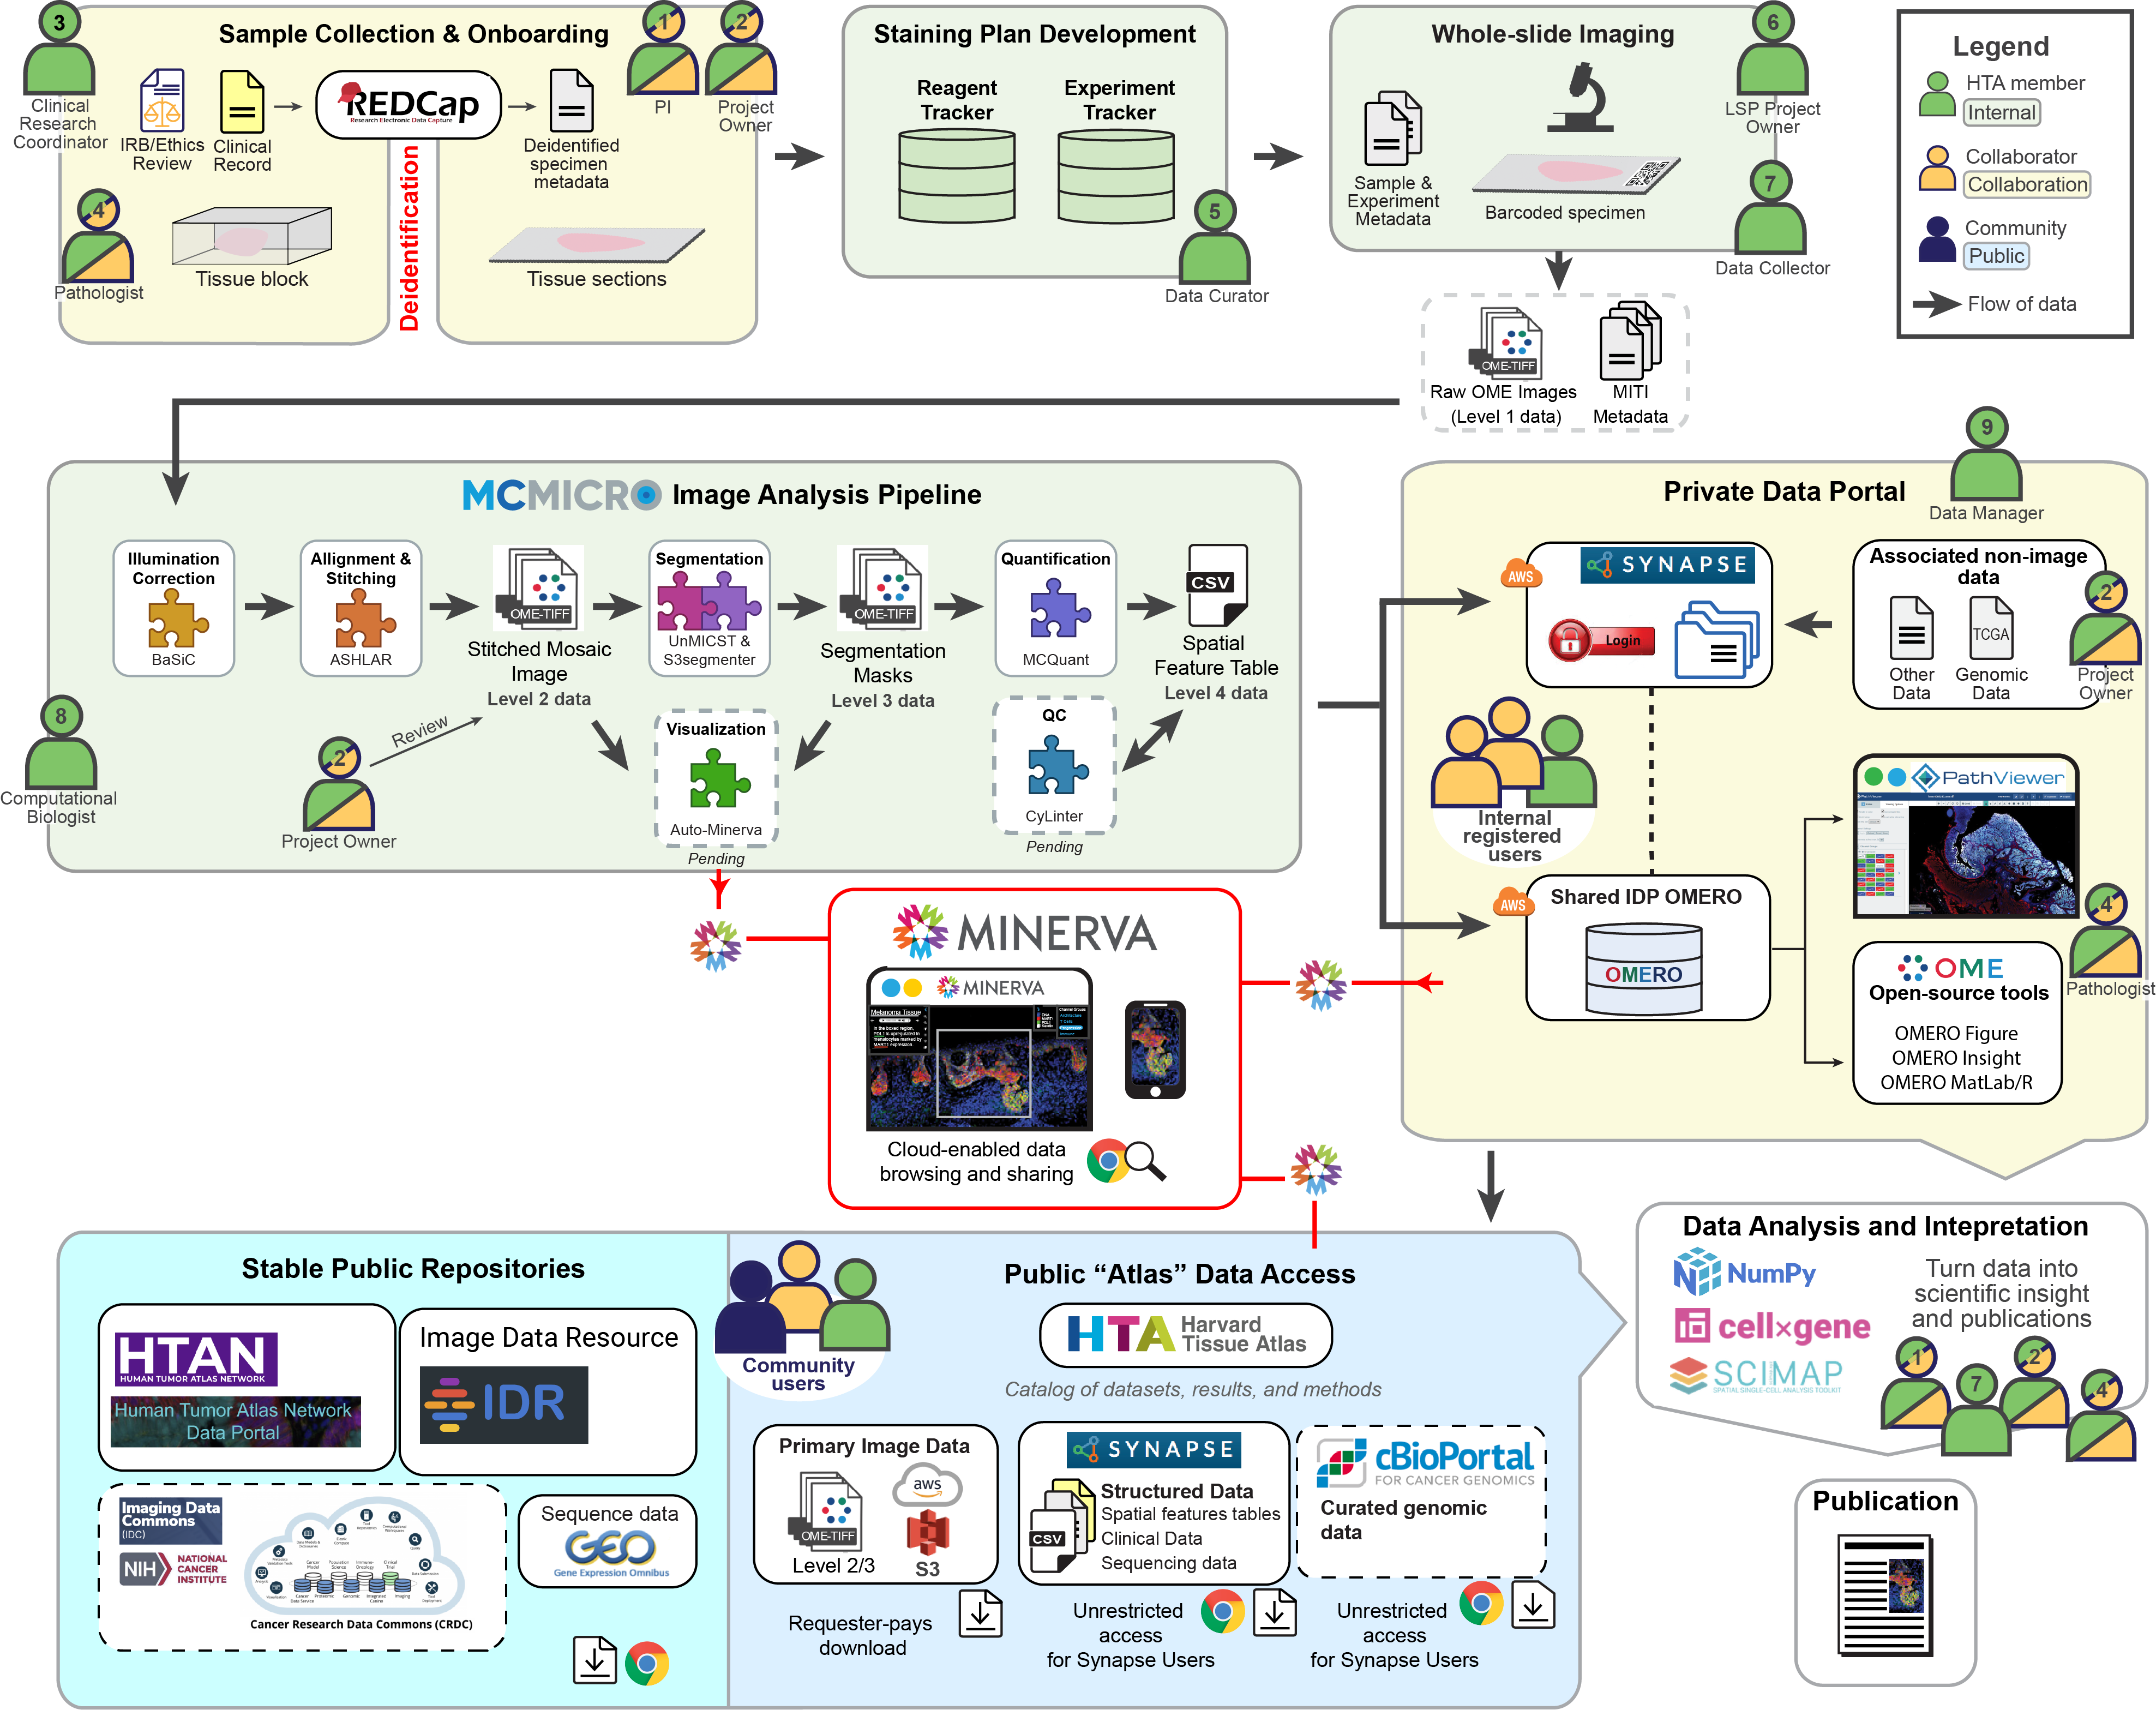
This graphic depicts the flow of data into the Harvard Tissue Atlas (HTA). Data arise from collaborations between HTA members (green) and additional collaborators (yellow). Before depositing data into the atlases, the data goes through sequential databases, experimental methods, and interoperable software. Different roles within the workflow are numbered for clarity – note that a single person might hold multiple roles.
Slide onboarding and data collection
First, tissue samples from collaborators (Role 2) are onboarded into the LSP by a clinical research coordinator (Role 3) and data curator (Role 4). These de-identified samples are cataloged into internal LSP databases (Experiment Tracker and Reagent Tracker) and combined with a detailed plan for how the sample will be stained. The experimental team (Roles 5 and 6) then stains and images the whole slide, resulting in up to 1,000 high-magnification image tiles per slide.
Data quantification & analysis
A computational biologist (Role 7) extracts data from these image tiles with MCMICRO, a microscopy software pipeline developed by the LSP. The MCMICRO modules use algorithms to combine the tiles into a single high-plex mosaic image, segment the mosaic image (to isolate single cells), and extract image data (like single-cell intensity and cell morphology), which is recorded in a Spatial Cell Feature Table. Close collaboration with the project owner and pathologist (Roles 2 and 8) is required to assess the resulting data quality at various stages of analysis.
Primary data is deposited onto online databases that allow the project team to dynamically view the data and collaborate on analyses. A data manager (Role 9) oversees access to these private data portals on Sage Synapse. At this point, project owners can add additional data types into the databases - consolidating data in one place facilitates subsequent collaboration and analysis.
Now the scientific discovery process begins. New biological insights require both human inspection of the images and quantitative analysis of the single-cell data. This is highly collaborative (Roles 1, 2, 7, and 8) and is where the greatest innovation occurs!
Sharing image data and derived knowledge A goal of the HTA is to support data sharing. We release data to the public first through Minerva stories, which allow the project team to narrate a data-driven story and users to pan and zoom through the images manually without needing to download the data.
After publication, HTA data are deposited into existing public repositories or made available using public cloud storage systems.
To learn more about these steps, visit our curriculum:
MCMICRO OMERO Integrating Spatial Data Minerva Other Talks
About Minerva: Viewing image data online
Accessing terabyte-size full-resolution image data is impractically burdensome for browsing a large dataset, so we have developed a specialized browsing tool, Minerva, to enable panning and zooming across large images using a standard web browser.
Minerva is a suite of software tools for visualizing, annotating, and sharing high-plex tissue images in a browser with an accompanying narration. Minerva makes it possible to interact with large, whole-slide images without downloading any data or installing any software. Minerva can also be used to share image annotations and display additional types of data visualizations. Nearly all Harvard Tissue Atlas data are available as one of three types of Minerva-based visualizations, described below.
Narrated Minerva Stories
Narrated stories use multi-step narrations and annotations to walk a viewer through key features of the data. Narrated stories distill the multidisciplinary knowledge encompassed by each dataset into a single product that grounds the scientific analyses in the underlying data and metadata. Click the Minerva story icon for an interactive view of the full-resolution images.
Curated Minerva Stories
Curated stories provide access to images that have undergone a quality control step to remove failed markers, ensure appropriate channel intensity settings, and provide metadata about the underlying sample and image. Click the Minerva story icon for an interactive view of the full-resolution images.
Automated Minerva Stories
Automated Minerva stories provide a single, minimally-processed (Level 2 or 3) whole slide image with no annotation or analysis. Automated stories provide online viewing access to largely unprocessed image data. These stories can be made automatically as part of the MCMICRO pipeline.
PUBLIC ACCESS TO PRIMARY DATA
A key goal of the HTA is to provide access to primary data consistent with FAIR Principles. Data types with an available public repositories (i.e., transcriptomic data via GEO) are made available at the time of publication. For imaging data this remains a work in progress, as there is no funding-agnostic public repository available to accept whole slide tissue images.
All NCI Human Tumor Atlas Network data are released via the HTAN data portal. We are working to release datasets associated with other funding mechanisms via public repositories.
Most images and metadata are available in an AWS S3 bucket at a location specified for each paper’s data availability statement. For up-to-date instructions on how to download image data found on this website, please visit our access instructions on Zenodo (DOI: 10.5281/zenodo.10223574). Email tissue-atlas(at)hms.harvard.edu if you have questions or experience issues.
Data Standards for Highly Multiplexed Tissue Images
We developed a standard for multiplexed tissue imaging called Minimum Information about highly multiplexed Tissue Imaging (MITI).
MITI Data Levels
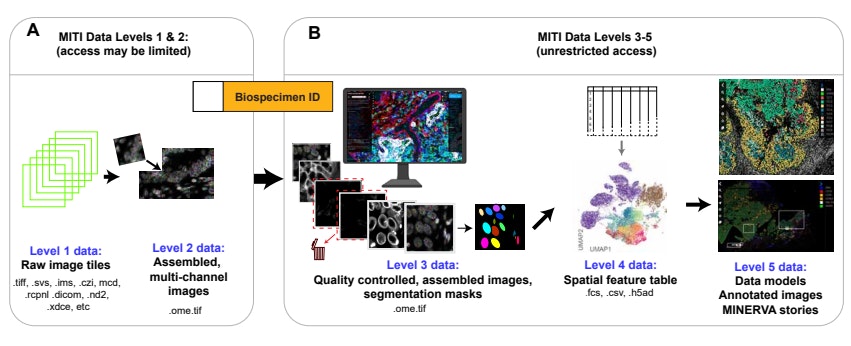
MITI adopted the concept of Data Levels from dbGAP to manage image data and the corresponding spatial profiles. Higher data levels are more processed. See the MITI publication for additional details and background information.
Level 1: Raw Image Tiles
Whole slide imaging usually involves acquisition of ~100 to 1,000 individual image tiles, each collected from a different X and Y location.
Level 2: Assembled Images
Full-resolution images have undergone automated stitching, registration, illumination correction, background subtraction, intensity normalization, and have been stored in a standardized OME format.
To achieve this, Level 1 image tiles are combined at sub-pixel accuracy into a mosaic image in a process known as stitching. When high-plex images are assembled from multiple rounds of lower-plex imaging, it is also necessary to register channels to each other across imaging cycles and to correct for any unevenness in illumination (so-called flat fielding). Stitched and registered mosaics can be as large as 50,000 x 50,000 pixels x 100 channels, requiring ~500 GB of disk space.
Level 3: Image Assembly and Segmentation Masks
Level 3 data represent images that have been processed with some interpretive intent. Interpretive intent may include (i) full-resolution images following quality control or artifact removal, (ii) segmentation masks computed from such images, (iii) machine-generated spatial models, and (iv) images with human or machine-generated annotations. A primary goal of the Harvard Tissue Atlas is to distribute level 3 data.
Level 4: Spatial Features Tables
Level 4 data comprise features derived from level 3 images, most commonly single-cell features in “spatial feature tables” that describes marker intensities, cell coordinates, and other single-cell features.
Level 5: Higher Level Data Representations
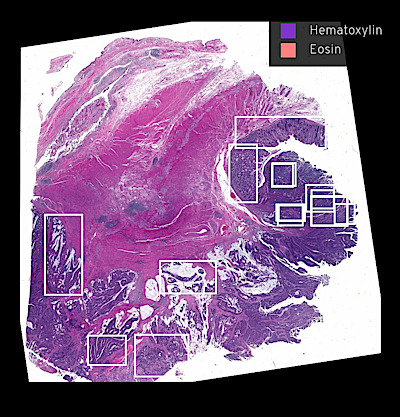
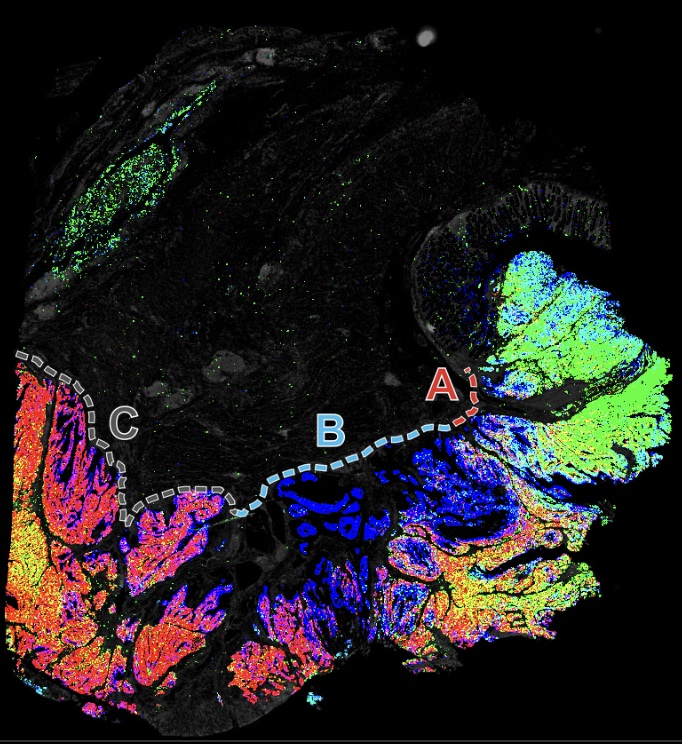
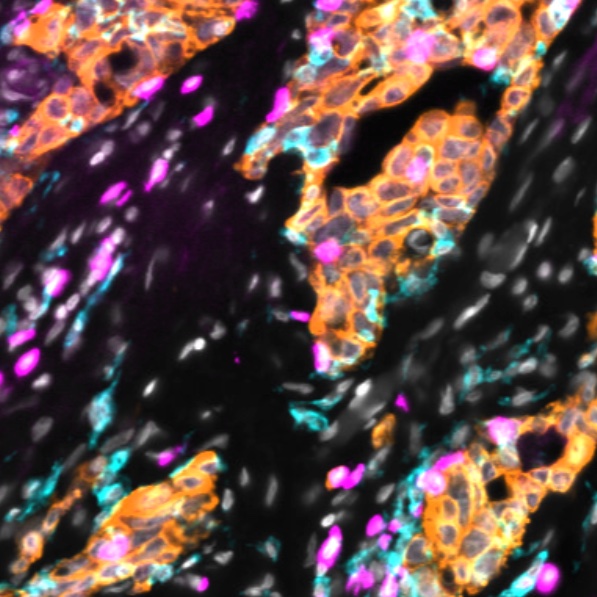
Level 5 data includes results computed from spatial feature tables or primary images. This can include images presented in image viewers like Minerva.
 Click to enlarge.


 Click to enlarge.